Time is a scarce resource. The possibility of being able to examine one’s own production from different angles is a core idea of TWINCULATORS. The review of time data is elementary to achieve process improvements and revenue increases. The aim is always to make optimum use of the possible production time. The Resource-Monitoring-Calculator forms the basis of the TWINCULATORS software. It enables you to keep track of the time. An overview.
Dynamic Value Stream Analysis (DVSA), implemented in the TWINCULATORS software, is the next step when it comes to managing production and processes. A complete image of production in real time replaces the snapshot of classic value stream analysis in Lean Management. It is based on sensor and plant data from production. Prepared, analyzed and presented in a meaningful form, it provides the added value that companies hope to gain from digitalization. TWINCULATORS is modularly structured in four calculators. Within these calculators, the user can choose from various analysis functions, which can be configured individually. The base is the Resource-Monitoring-Calculator. The first step towards a complete understanding of the production processes is an overview of the different time modules required for a process display. This is guaranteed by the Resource-Monitoring-Calculator.
With the help of this calculator it is possible to display and analyze the state of production by looking at cycle and setup times. At the same time, the Resource-Monitoring-Calculator displays the current performance of production. The question of whether target times and actual times of processes match is answered by a short look at the TWINCULATORS software.
The question of whether target times and actual times of processes match is answered by a short look at the TWINCULATORS software.
The continuous analysis of times through the Cycle Time Analyser allows a visualization of the process stability, whereby the observation period is freely scalable between hours, days and months. In addition, various filter settings allow for a resource-, process-, or product-specific analysis of the cycle time. The boxplots used to display the cycle time provide an overview of all statistically relevant key figures in the observation period (refer to fig. 1).
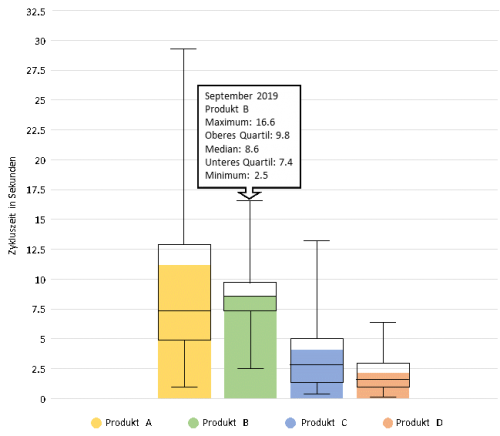
Figure 1: Cycle Time Analyser as TWINCULATOR base function
Another factor of an optimized production is flexibility. KPMG argued as early as 2016 that in order to adjust all production processes precisely, set-up times in particular must be optimized, free capacities created and emerging potentials exploited (KPMG, 2016, p.17). The Resource-Monitoring-Calculator‘‚ Changeover Analyser provides a target/actual comparison of setup performance. By displaying the setup times in a setup time matrix, a setup sequence optimization can be created. In addition, this makes it possible to identify the product-specific setup performance. Losses due to non-optimized changeover processes are a thing of the past with the Resource-Monitoring-Calculator.

Figure 2: Change Over Analyser Interface of a setup time matrix
Losses due to non-optimized changeover processes belong to the past with the Resource-Monitoring-Calculator.
The optimization of cycle and setup times in order to adjust throughput times has a direct effect on production performance. McKinsey describes an effective performance management with 5 elements (McKinsey, 2019). The selection and analysis of the right data from the right sources at the perfect time and place is done by the Performance Analyser, which is another function of the Resource-Monitoring-Calculator. Based on the time data, the Performance Analyser evaluates the performance in any given period.
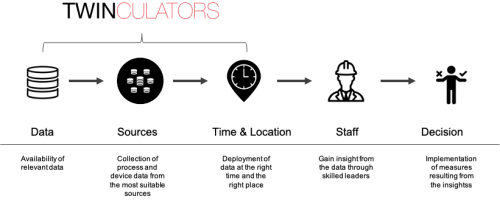
Figure 3: TWINCULATORS as implementation of the 5 elements for a good performance management system according to McKinsey (McKinsey 2019)
Here, as in all other functions of the calculator, it is possible to filter by product, process and equipment, which allows you to determine the performance individually. This enables detailed analyses and adjustments.
Keeping an eye on time is made easy by the Resource-Monitoring-Calculator. The earlier described analyser for cycle time, change over time and performance allow an intelligent and high-performance use of the numerous production data. McKinsey states in their article that a bad system for managing performance is even worse for a company, than not using one at all – therefore you should use a good one: www.twinculators.com